In Barcelona, SAP Hybris Labs demonstrated how visitor data can be visualised in a virtual reality galaxy - in real time. The aim is to make data easier to understand and analyse.
Bar charts are actually pretty old school. And yet they are the standard tool when it comes to preparing data for marketing. SAP Hybris Labs has now demonstrated another option at its annual Global Summit. In a Experience report a journalist tells us what he experienced. We summarise:
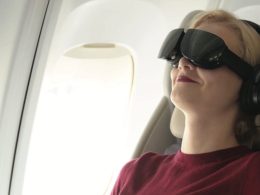
The tester was able to try out what real-time analysis via virtual reality feels like. Equipped with a VR headset, he was able to see via VR how the mass of SAP congress visitors behaved, but at the same time he could also see his own data trail that he left behind at the congress.
Personal profile plus localised data
The basis for the VR experience was his personal profile, which was created using his registration data and the workshop agenda that he put together after registering. At the congress itself, his profile data was enriched with his live data: among other things, cameras were used to track which information stands and lecture theatres he visited in order to better understand his interests.
In addition to the movement and position data, his reactions to the voice control of the Galaxy application also came into play in the virtual reality demo in order to ultimately obtain a 360-degree image of him as a visitor to the congress. At the end of the demo, the virtual voice assistant asked him which data he was particularly interested in. The answers are to be analysed using machine learning and help to further develop the system.
Virtual reality creates new access to mass data
The aim, according to Anja Wilbert, UX designer at SAP Hybris Labs, is as follows: By making the data tangible with the three-dimensional representation as a galaxy cluster, companies should gain a different approach to their mass data and thus also understand data better.
She and the Labs team want to stimulate a discussion about the extent to which such virtualisation makes the work of managers and marketers easier. She can well imagine this for e-commerce in particular: An online retailer can use VR to see where their customers are right now: on Twitter, on Facebook, in the online shop or in the shop round the corner. They can use this data to launch or review a campaign.
If the campaign does not go as planned, the e-commerce retailer can take immediate countermeasures. They are warned by a red light or hoots if the planned customer journey is cancelled at any point.
The tester believes that VR may make sense for this use case, but that it may not be the optimal form for complex data analyses, for example with regard to budget planning or channel analyses.
The whole thing still sounds very abstract.
Source: t3n.de /SAP Hybrid


